Dashboards
An application may define one or more dashboards. If it is a home automation application A dashboard could be a room or a floor. Each dashboard contains one or more panels where it is possible to link sensors, controllers, camera and other components. The dashboards are responsive and adjust to the width of the browser. Below is the same dashboard in mobile and browser view.
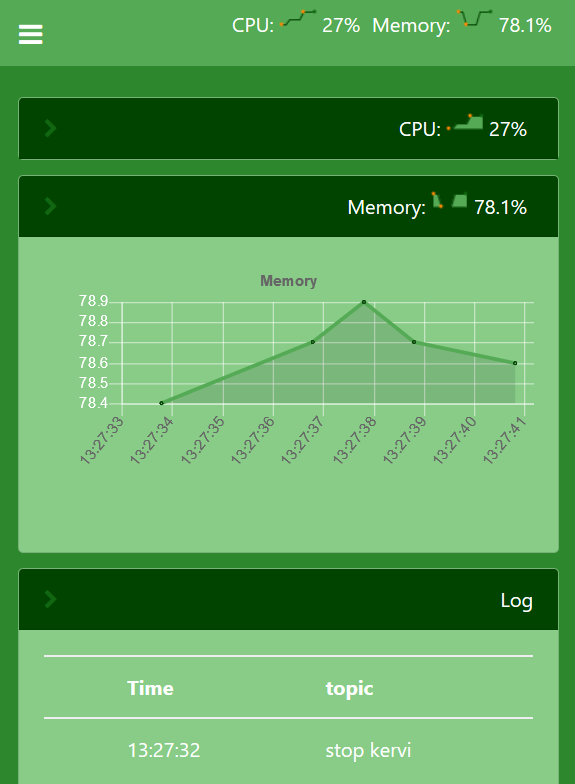
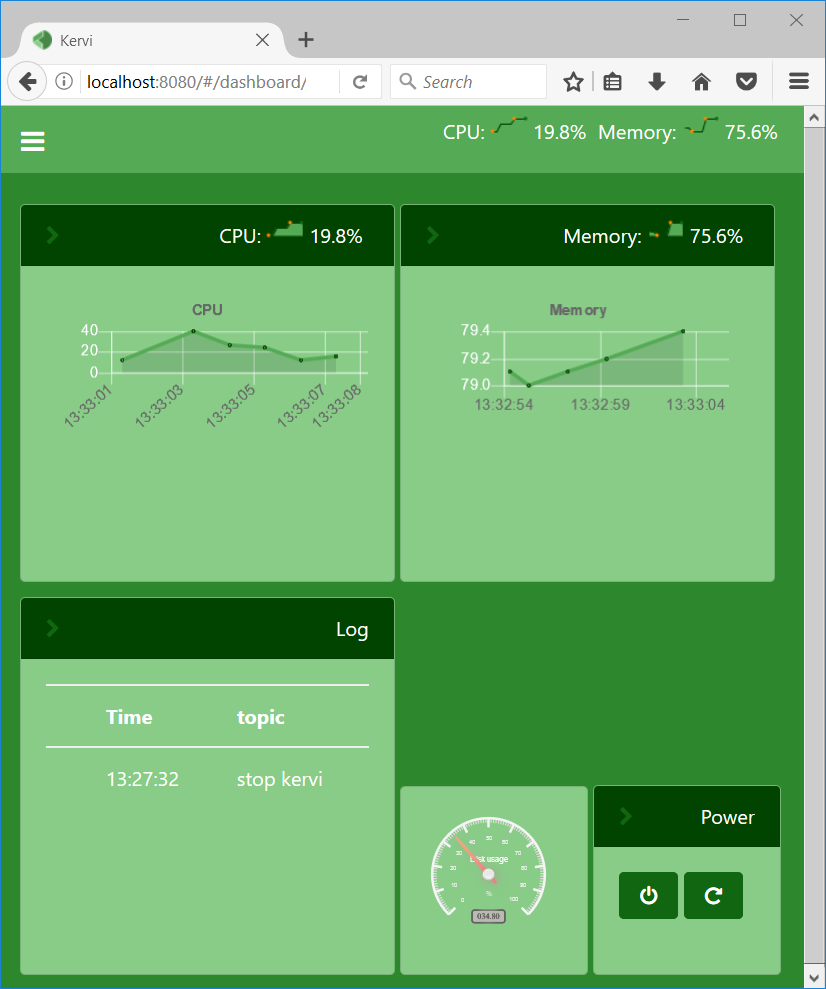
The code below shows how to configure the dashboard above
Dashboard(
    "system",
    "System",
    [
        DashboardPanel("cpu", width=30),
        DashboardPanel("memory", width=30),
        DashboardPanel("log", width="250px", title="Log", user_log=True),
        DashboardPanel("disk"),
        DashboardPanel("power")
    ]
)
On large displays the width parameter specify the relative the width of the browser window.
If a title is set for a panel it will be displayed in a header.
If user_log is set to true the panel will show the content of the user log for the application.
Linking
A kervi component is linked to a panel by calling the link_to_dashboard method on the component. This method takes several parameters that specify how the component should be displayed.
When a component is linked to a panel you are able to set the width and height of the component it could be as a percentage or pixels.
The kervi framework creates a default dashboard if no dashboards has been defined in your app. In the same way panels are created on the fly if the call to link_to_dashboard doesn’t include panel name.
#sensor that links as a radial guage
cpu_temp.link_to_dashboard("cam", "panel1", type="radial_gauge", width=30)

#A sensor that links to the header of a panel and into the body.
cpu_temp.link_to_dashboard("system", "cpu", type="value", link_to_header=True)
cpu_temp.link_to_dashboard("system", "cpu", type="chart", width="200px")

#A button that links to a panel with an icon.
GPIO[12].link_to_dashboard("system", "power", icon="power-off")
Sensors and numbers
Linked output components like sensors, controller outputs and analog GPIO input channels can displayed in different ways: just value, value with sparkline, as an animated icon, chart or different kind of gauges.
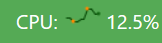
Value and sparkline
If a sensor is linked with just dashboard and panel as parameters it will be displayed with name, sparkline and value.
SENSOR_1.link_to_dashboard("system", "section1")
Value and icon
It is possible to show an icon next to a value. Kervi uses Font awesome icons. Just enter the name of the icon without fa-
SENSOR_1.link_to_dashboard("system", "temp", icon="thermometer-full", show_sparkline=False, show_name=False)
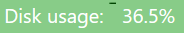
Value and no sparkline
SENSOR_1.link_to_dashboard("system", "section1", show_sparkline=False)
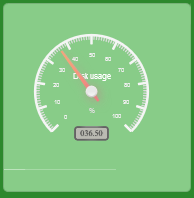
radial gauge
SENSOR_1.link_to_dashboard("system", "section1", type="radial_gauge")
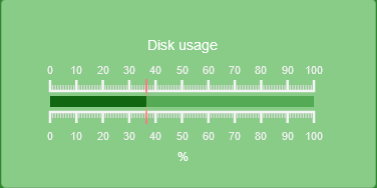
Horizontal gauge
SENSOR_1.link_to_dashboard("system", "section1", type="horizontal_linear_gauge")
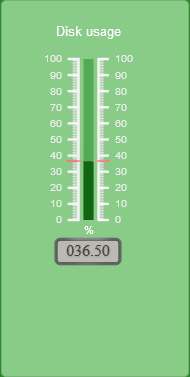
Vertical gauge
SENSOR_1.link_to_dashboard("system", "section1", type="vertical_linear_gauge")
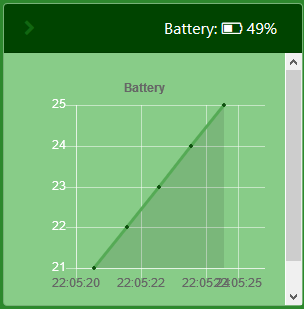
Animated icon
Below is a full example of a battery sensor where the icon change depending on value. The sensor is linked twice first to the header with the animation and into the body as a chart.
SENSOR_1.set_ui_parameter("icon", [
    {
        "range":[0, 5],
        "icon":"battery-empty"
    },
    {
        "range":[5, 25],
        "icon":"battery-quarter"
    },
    {
        "range":[20, 50],
        "icon":"battery-half"
    },
    {
        "range":[5, 75],
        "icon":"battery-three-quarter"
    },
    {
        "range":[75, 100],
        "icon":"battery-full"
    }
])

#link the sensor to the header
SENSOR_1.link_to_dashboard(
    "system", "battery",
    show_sparkline=False,
    show_value=False,
    link_to_header=True
)

#link the sensor as a chart
SENSOR_1.link_to_dashboard("system", "battery", type="chart")
Controller pads
Each dashboard has two controller pads each with an x and y-axis. It is possible to link NumberValue values to these axes by using the panel names left_pad_x, left_pad_y, right_pad_x, right_pad_y.
motor_controller.dc_motors[0].speed.link_to_dashboard("main", "left_pad_x")
GPIO and boolean values
Linked output components like digital GPIO channels and boolean controller input/outputs are displayed as a switch button or push button. If the GPIO pin is an input channel or a controller output the button is read only.
If GPIO pin is an output channel or a controller input the user will be able to switch/push the button.